
What is Confusion Matrix and why you need it?
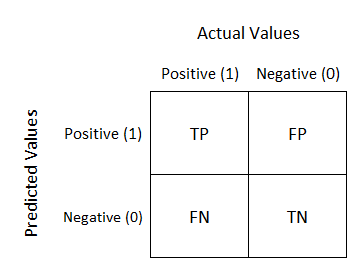
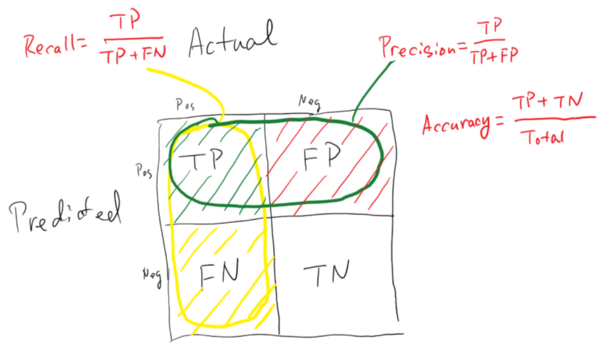
Well, it is a performance measurement for machine learning classification problem where output can be two or more classes. It is a table with 4 different combinations of predicted and actual values.
It is extremely useful for measuring Recall, Precision, Specificity, Accuracy and most importantly AUC-ROC Curve.
Let’s understand TP, FP, FN, TN in terms of pregnancy analogy.
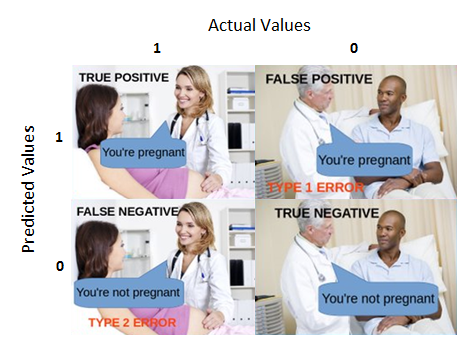
True Positive:
Interpretation: You predicted positive and it’s true.
You predicted that a woman is pregnant and she actually is.
True Negative:
Interpretation: You predicted negative and it’s true.
You predicted that a man is not pregnant and he actually is not.
False Positive: (Type 1 Error)
Interpretation: You predicted positive and it’s false.
You predicted that a man is pregnant but he actually is not.
False Negative: (Type 2 Error)
Interpretation: You predicted negative and it’s false.
You predicted that a woman is not pregnant but she actually is.
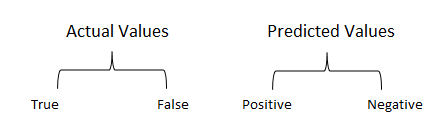
Just Remember, We describe predicted values as Positive and Negative and actual values as True and False.
How to Calculate Confusion Matrix for a 2-class classification problem?
Let’s understand confusion matrix through math.
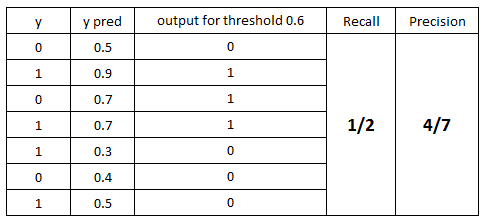
Recall
Out of all the positive classes, how much we predicted correctly. It should be high as possible.
Precision
Out of all the classes, how much we predicted correctly. It should be high as possible.
F-measure
It is difficult to compare two models with low precision and high recall or vice versa. So to make them comparable, we use F-Score. F-score helps to measure Recall and Precision at the same time. It uses Harmonic Mean in place of Arithmetic Mean by punishing the extreme values more.
#Calculate Confusion matrix for string
class CONFUSION_MATRIX():
    def __init__(self,KWS=['_', 'b', 'c', 'd', 'e', 'f', 'g']):
        super(CONFUSION_MATRIX, self).__init__()
        self.TP=[];self.TN=[];self.FP=[];self.FN=[];self.CM=np.zeros((len(KWS),len(KWS)))
    def Calc_Confusion(self,ORG,APP):
        def str_dict_compare(d1, d2):
            if type(d1)==str:  d1_keys = set(d1);d2_keys = set(d2)
            elif type(d1)==set:d1_keys = set(d1.keys());d2_keys = set(d2.keys())
            else:print('Type {} not supported, in class CONFUSION_MATRIX'.format(type(d1)));return
            intersect_keys = d1_keys.intersection(d2_keys)
            added = d1_keys - d2_keys
            removed = d2_keys - d1_keys
            same=d2_keys-removed
            return added, removed,same
        added, removed,same=str_dict_compare(ORG,APP)
        CM=self.CM
        for k in same:CM[KWS.index(k),KWS.index(k)]+=1
#         if len(same)>0:removed={};added={} # This audio found!
        for k in removed:CM[0,KWS.index(k)]-=1
        for k in added:CM[KWS.index(k),0]-=1
        CM[0,0]+=int(ORG==ORG=='')

        self.CM=CM
        self.TP.append(len(same))
        self.FP.append(len(removed))
        self.FN.append(len(added))
        self.TN.append(int(ORG==ORG==''))

    def Cal(self,x):
        total=sum(x)
        su=0;q=[]
        for k in range(len(x)):
            su+=x[k]
            q.append(su/total)
        return q
    def Final_Calc(self):
        self.TPR=self.Cal(self.TP)
        self.FPR=self.Cal(self.FP)

    def plotCM(self):
        self.Final_Calc()
        TN=self.CM[0,0];self.CM[0,0]=0
        df_cm = pd.DataFrame(self.CM.astype(np.int64), columns = KWS,index= KWS)
        plt.figure(figsize=(17,6))
        plt.subplot(121)
        sn.heatmap(df_cm, annot=True,cmap="PiYG",center=0, linewidths=1, linecolor='lightgray',
                  cbar_kws={"orientation": "vertical","label": "Number of accidents"}
                  )
        self.CM[0,0]=TN
        plt.text(0.3,0.2, '%d' % TN,ha='center',va='center', color='b')

        plt.subplot(122)
        plt.grid(True)
        plt.plot([0,1],[0,1],'--r')
        plt.scatter(self.TPR,self.FPR)


cf=CONFUSION_MATRIX()

with open('/home/u/2018/ViVos/data/ViVos_08/LSTM4Layer_500/LSTM4Layer_500_chkPoint.pkl.predict.txt')as f: txt=f.read()
txt=txt.splitlines()
txt=[ss.split('|')[1:3] for ss in txt]

for ORG, APP in txt[1:]:
    cf.Calc_Confusion(ORG,APP)

cf.plotCM()
Results:

Cách vẽ ROC curve
Nhìn cái hình này rất dễ hiểu:
Trong đó: C là cột giá trị dự đoán đúng/sai so với True label. Score là điểm số của hàm predict output (Model của mình không có cái này, nên bỏ qua thôi) Nếu có score, thì trước khi vẽ, phải sắp xếp theo score, có thể tăng dần/giảm dần, đồ thị sẽ khác đi đấy. trong hình này là giảm dần. còn của ví dụ dưới đây là tăng dần.
Có một ví dụ khá trực quan tại đây: Drawing ROC Curve, nhưng ví dụ này bị lỗ hở ở chỗ này:
plt.xlim(0.0, 1.0)
plt.ylim(0.0, 1.0)
Mình đã thử độc chính xác của thuật toán bằng cách nhân đôi kết quả, và phát hiện: Họ che đậy phần thừa ở hình vẽ, nhưng nếu chúng ta bỏ hai lệnh này đi, thì phần ẩn sẽ lộ ra, không thể hiện thị chuẩn được nữa. Sai ở chỗ, nó chỉ hiển thị phần đầu, còn các phần sau nó ẩn đi, vậy, nếu đoạn đầu của DL hiển thị rất ngon, predic rất tốt, còn đoạn sau đoán toàn sai thì sao? - k nhìn thấy!. Nếu cùng 1 dữ liệu, ta xáo trộn nó đi, thì ROC curve trên tập DL sẽ không còn giống nhau nữa=> khả năng cao là sai.
à nhầm, nó bao biện bằng cách: thêm hàm
sortedscores = sorted(scores, key=itemgetter(1))
(sort scores by ascending order) nếu vậy, hai model khác nhau, M1 đoán thiên về hoặc đúng, hoặc sai => score của M1 dồn về 2 phía 0/1 => số phần tử sai có score thấp và số đúng score cao nhiều hơn, còn M2 đoán sâm sấp tăng dần đều, nhưng tổng số dự đoán đúng của M1>M2, thì khi nhìn vào ROC ta vẫn thấy M2 tốt hơn M1 (vì chỉ in đoạn đầu, đoạn đầu M1 sai nhiều hơn) => không đánh giá đúng tổng quan hệ thống.
Xem thêm ở file này: Roc-Auc và ở đây nữa
code:
def get_rates(actives, scores):
    """
    :type actives: list[sting]
    :type scores: list[tuple(string, float)]
    :rtype: tuple(list[float], list[float])
    """
    tpr = [0.0]  # true positive rate
    fpr = [0.0]  # false positive rate
    nractives = len(actives)
    nrdecoys = len(scores) - len(actives)
    foundactives = 0.0
    founddecoys = 0.0
    for idx, (id, score) in enumerate(scores):
        if id in actives: foundactives += 1.0
        else:             founddecoys += 1.0
        tpr.append(foundactives / float(nractives))
        fpr.append(founddecoys / float(nrdecoys))
    return tpr, fpr

def draw_ROC():
    randomline=True
    label='Label ABC'
    #----------------------------------------------------------------
    actives= ['A', 'B', 'G', 'J', 'L', 'N', 'O']
    scores= [('A', 0.11), ('B', 0.35), ('C', 0.72), ('D', 0.1), ('E', 0.99), ('F', 0.44), ('G', 0.32), ('H', 0.8), ('I', 0.22), ('J', 0.08), ('K', 0.56), ('L', 0.48), ('M', 0.42), ('N', 0.73), ('O', 0.03), ('P', 0.65), ('Q', 0.71), ('R', 0.82),
            #('A', 0.11), ('B', 0.35), ('C', 0.72), ('D', 0.1), ('E', 0.99), ('F', 0.44), ('G', 0.32), ('H', 0.8), ('I', 0.22), ('J', 0.08), ('K', 0.56), ('L', 0.48), ('M', 0.42), ('N', 0.73), ('O', 0.03), ('P', 0.65), ('Q', 0.71), ('R', 0.82)
             ]
    scores = sorted(scores, key=itemgetter(1))
    #--------------------# depict_ROC_curve(actives, sortedscores, label, color, ofname)
    print("Plotting ROC Curve ...")
    plt.figure(figsize=(6, 6), dpi=80)
    plt.xlabel("FPR", fontsize=14)
    plt.ylabel("TPR", fontsize=14)
    plt.title("ROC Curve", fontsize=14)
    #--------------------------------# add_ROC_curve(plt, actives, scores, color, label)
    tpr, fpr = get_rates(actives, scores)
    roc_auc = auc(fpr, tpr)
    roc_label = '{} (AUC={:.3f})'.format(label, roc_auc)
    plt.plot(fpr, tpr, color='b', linewidth=3, label=roc_label)
    #-----------------------------------------------# save_ROC_curve_plot(plt, filename=ofname, randomline=True)
    if randomline:plt.plot([0.0, 1.0], [0.0, 1.0], linestyle='dashed', color='red', linewidth=2, label='random')
    plt.xlim(0.0, 1.0)
    plt.ylim(0.0, 1.0)
    plt.legend(fontsize=10, loc='best')
    plt.tight_layout()
    # plt.savefig(filename)
    plt.show()
    return 0
draw_ROC()
Kết quả

Các file đầu vào: code.py, actives.txt, scores_bad.txt,scores_good.txt,scores_normal.txt
Leave a comment